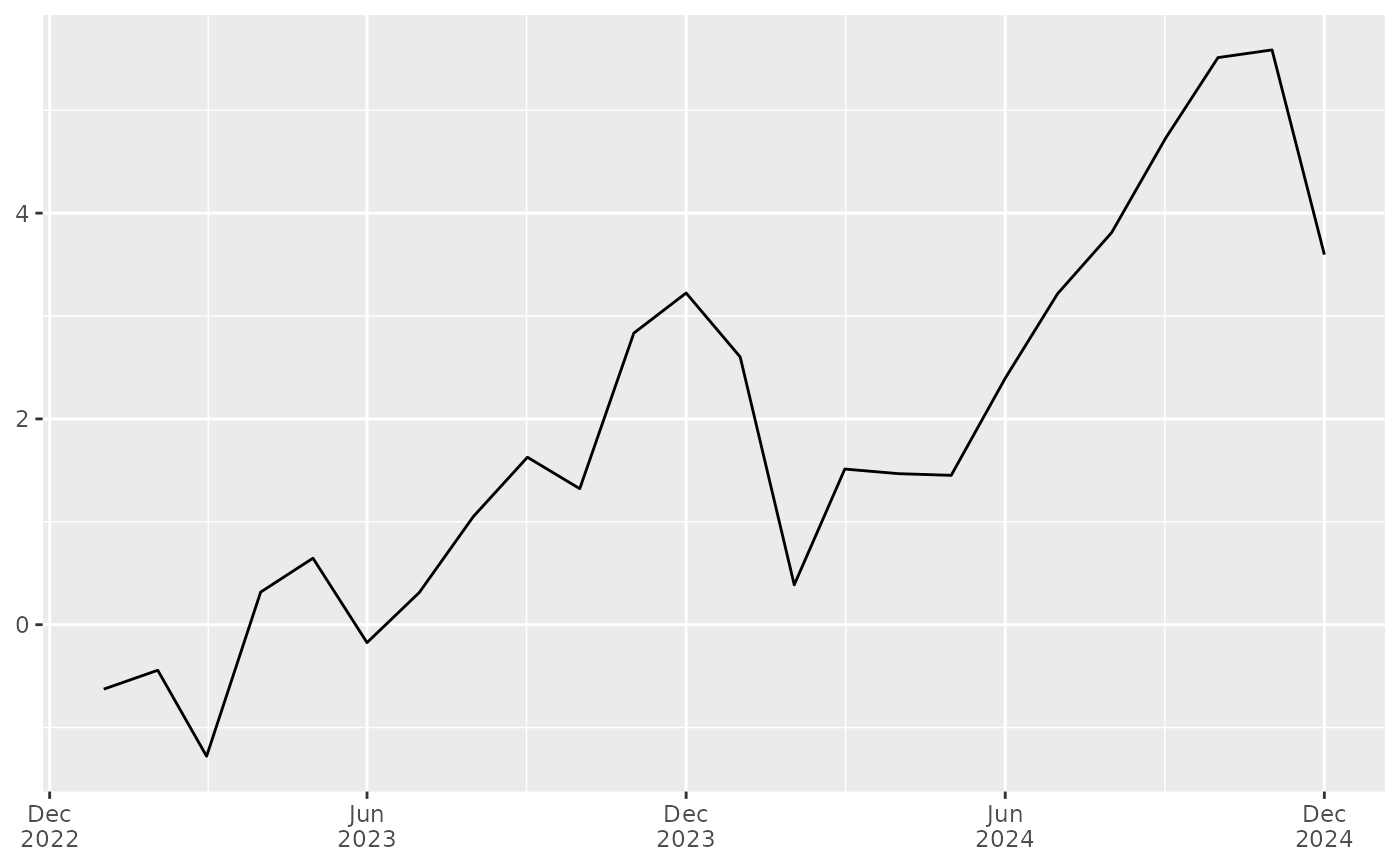
Create a breaks function for scale_x_date() that
always includes the last actual data month and then selects every
nth month counting backward.
See also
date_breaks_n, which takes the date vector directly
and returns a vector of breaks instead of a breaks function.
Examples
# Minimal reproducible example (avoid using the name `df`, which masks stats::df)
set.seed(1)
dat <- data.frame(
  date  = seq(as.Date("2023-01-01"), by = "month", length.out = 24),
  value = cumsum(rnorm(24))
)

library(ggplot2)

ggplot(dat, aes(date, value)) +
  geom_line() +
  scale_x_date(
    date_labels = "%b\n%Y",
    breaks = date_breaks_gg(n = 6, last = max(dat$date))
  ) +
  labs(x = NULL, y = NULL)