Generate a sequence of date breaks for ggplot scales,
taking every nth unique date.
Value
A vector of dates suitable for use as ggplot2 axis breaks. With the
default decreasing = TRUE, the first (most recent) date is always
included, so breaks are anchored to the last observation.
See also
date_breaks_gg, which returns a breaks
function for scale_x_date() and clips breaks to the plot
limits.
Examples
library(ggplot2)
library(dplyr)
#>
#> Attaching package: ‘dplyr’
#> The following objects are masked from ‘package:stats’:
#>
#> filter, lag
#> The following objects are masked from ‘package:base’:
#>
#> intersect, setdiff, setequal, union
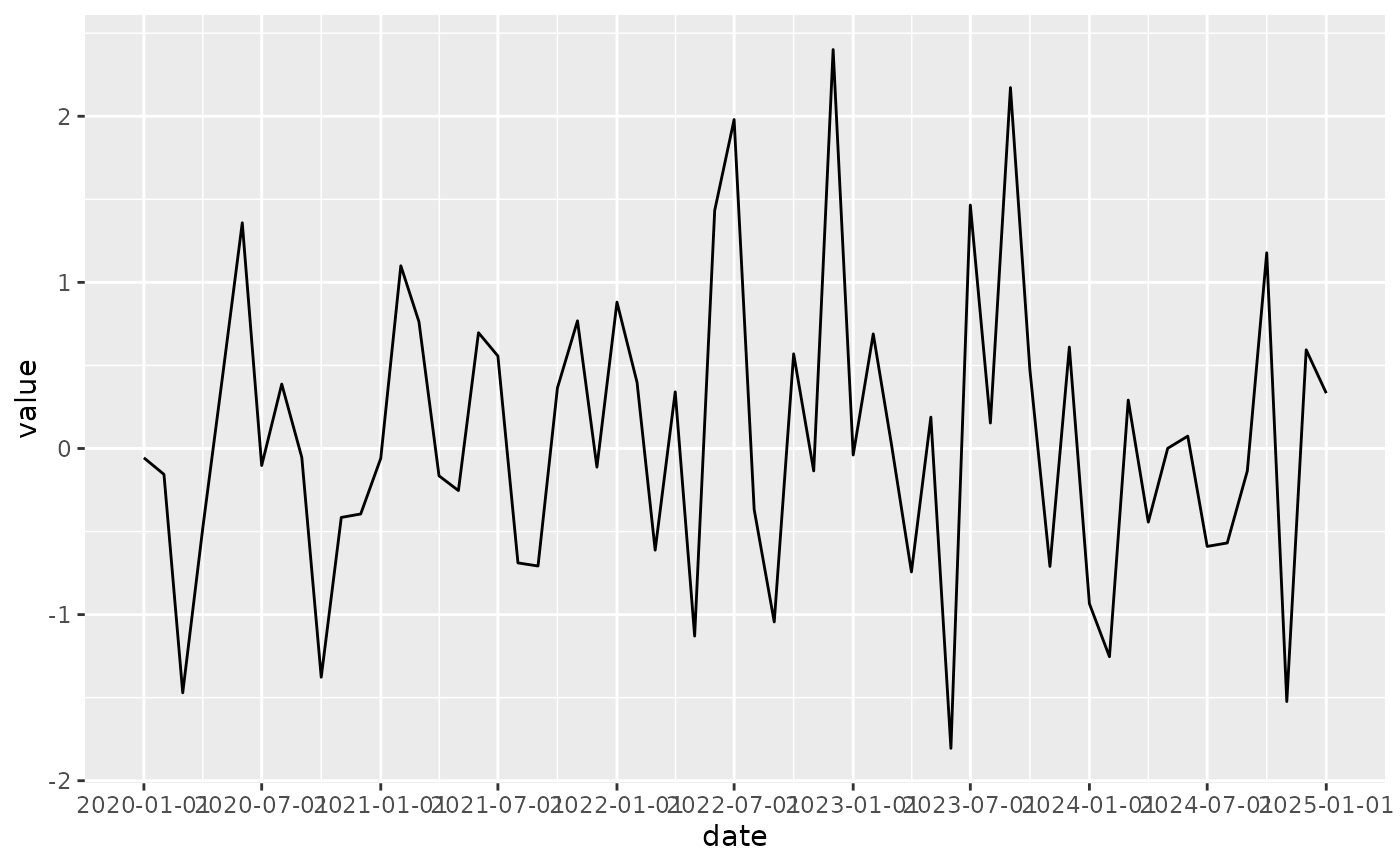
df <- tibble(
date = seq.Date(as.Date("2020-01-01"), as.Date("2025-01-01"), by = "month"),
value = rnorm(61)
)
ggplot(df, aes(date, value)) +
geom_line() +
scale_x_date(breaks = date_breaks_n(df$date, 6))